KORENGContactBrochure
Home · Products · SmartRunner OneIQ
Software · OneIQ

SmartRunner OneIQIntegrated Analytics

An integrated manufacturing analytics platform that connects production, quality, yield and equipment data into one, enabling integrated monitoring and analysis — and letting you ask questions in natural language. It links scattered data into a single pipeline to analyze everything from production status to quality, process stability and equipment anomalies without gaps.

Integrated Analytics

Production, quality, yield & equipment in one view

OneIQ Copilot

Natural-language query → table/chart answer

Air-gapped · Read-only

Safely, with a local LLM

Wafer Map · SPC · FDC

Process stability & equipment anomaly analysis

-50%
Analysis lead time (automation)
+1~2%p
Yield improvement (process/equipment optimization)
1 Platform
Production, quality, yield & equipment integrated
OneIQ Copilot · NEW

Don't know the menu?
Just ask in natural language

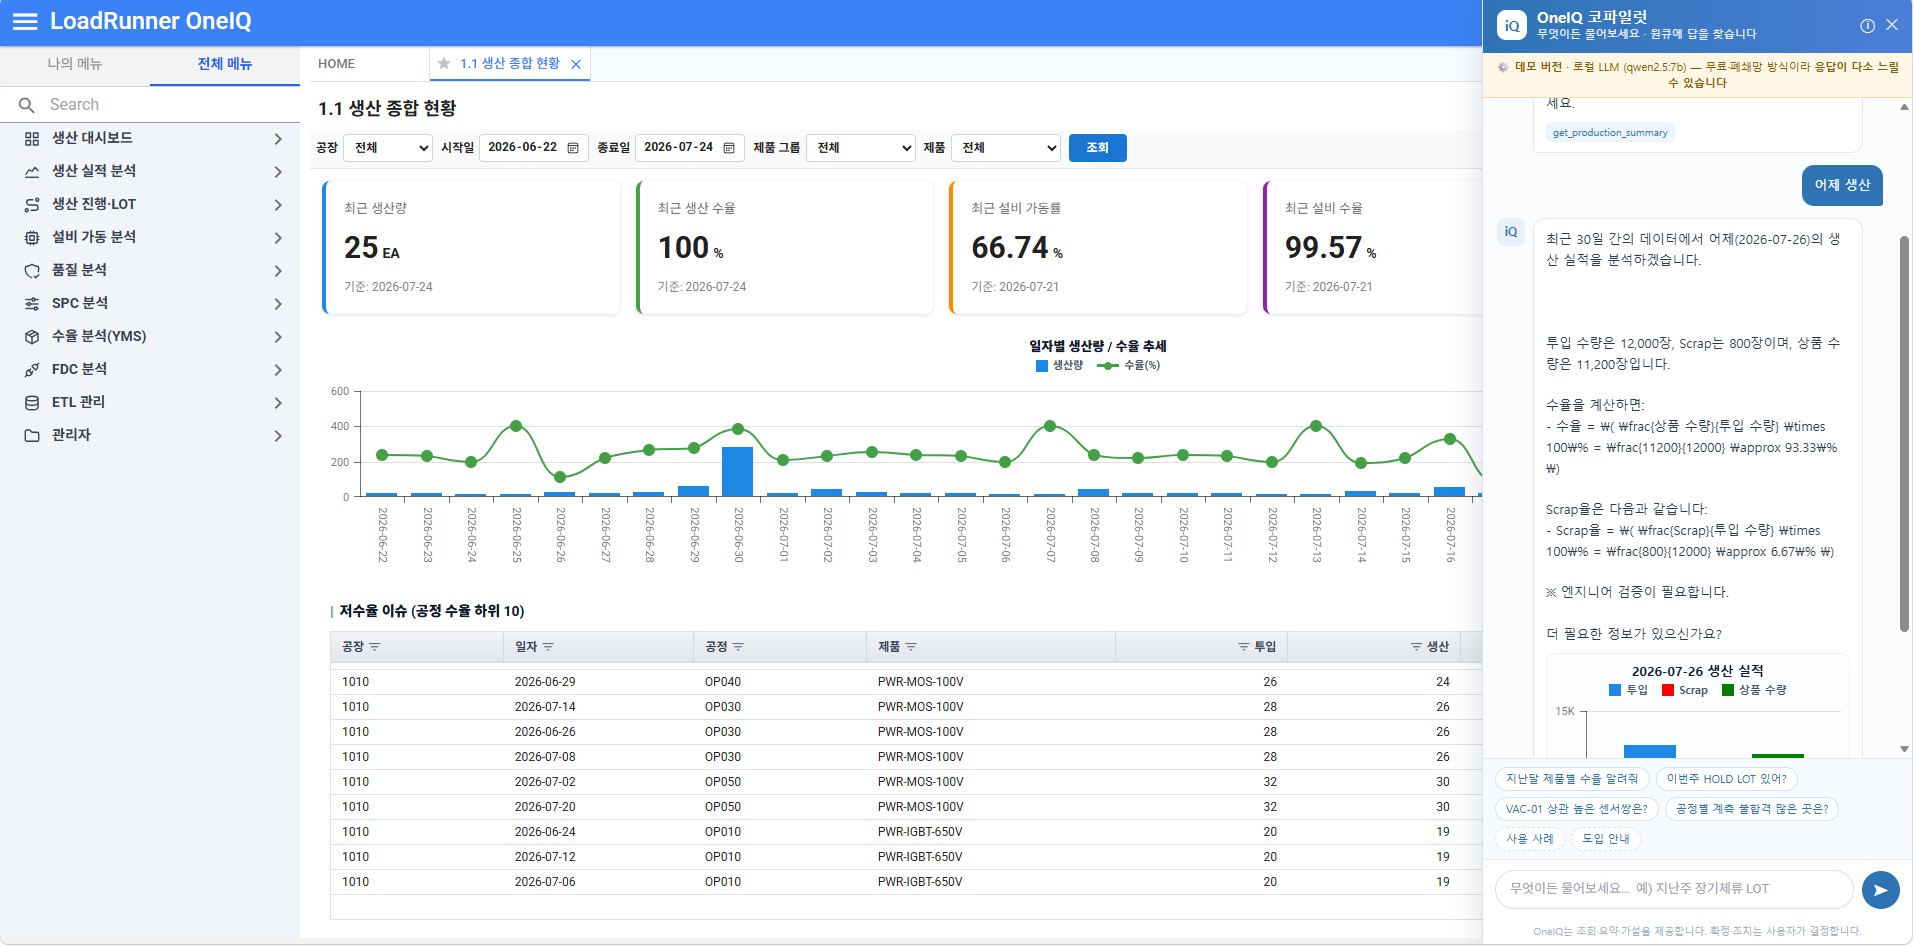
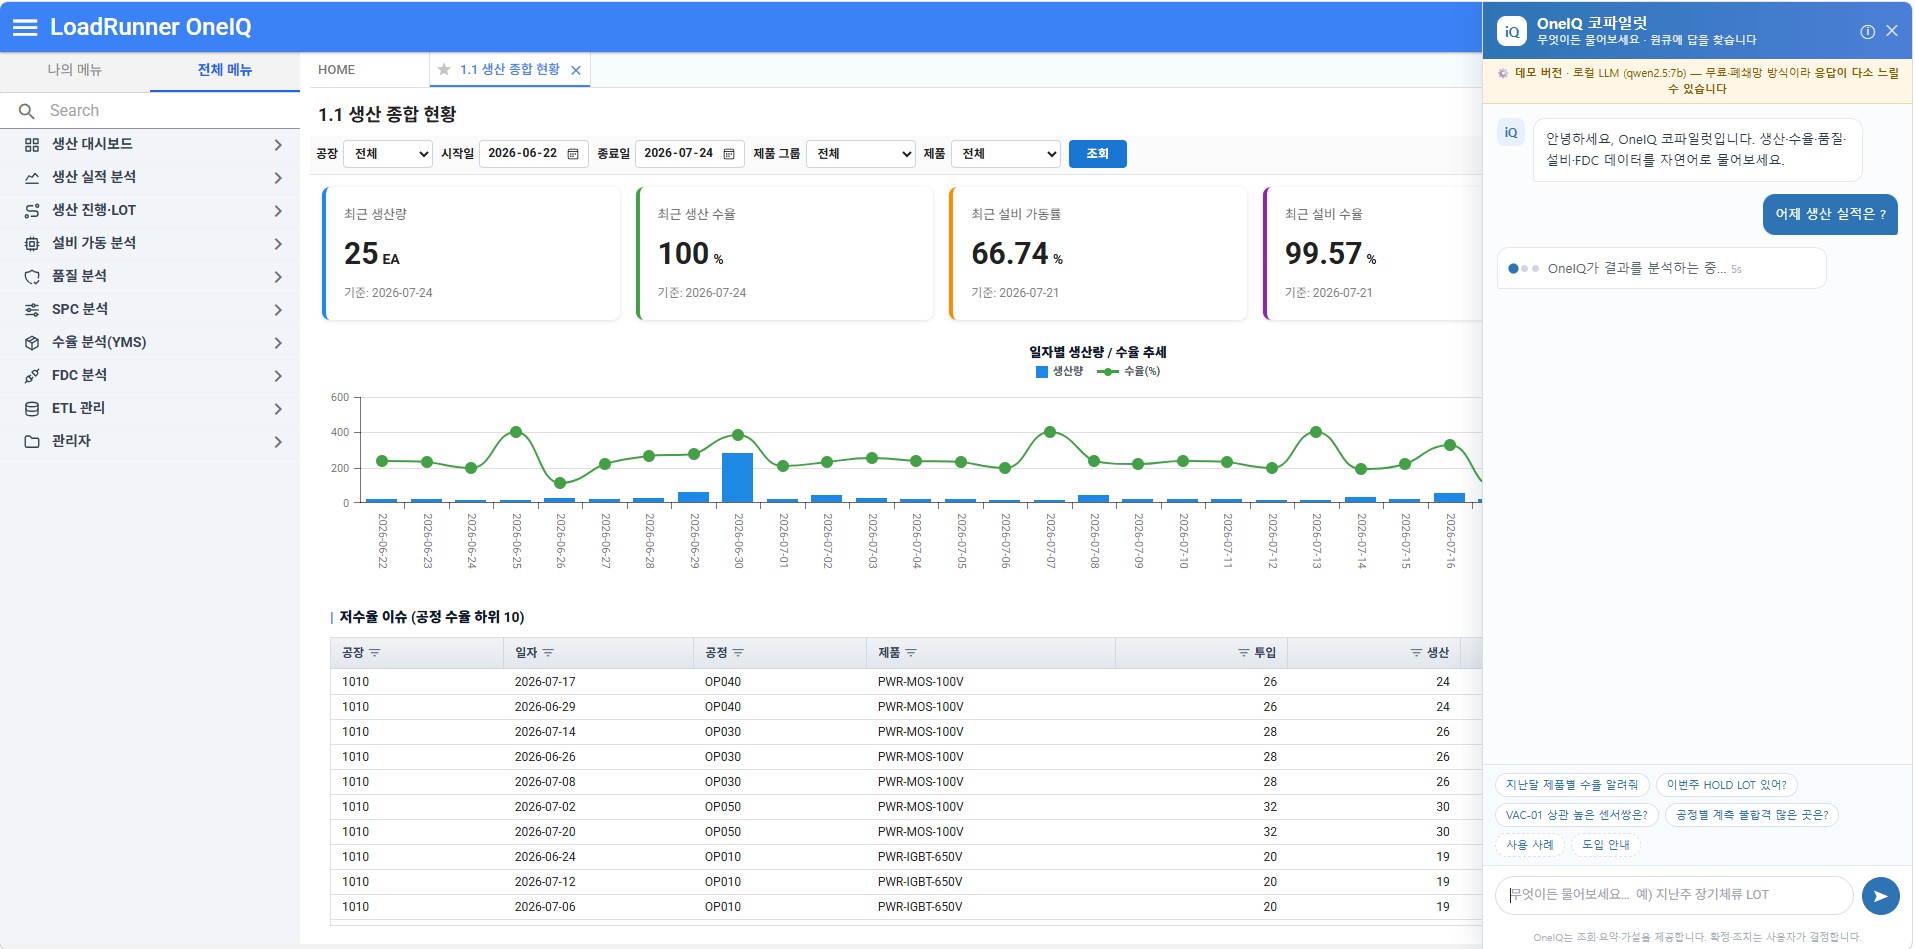
You don't need to know where the 60-plus menus are. Ask in natural language and the copilot finds the data you need and answers with tables and charts. Data queries and charts are handled by our own server while the AI only understands the question and composes the sentences — a read-only approach that is safe even on air-gapped networks with no internet.

DEMO Local LLM (qwen2.5:7b) · free · air-gapped · read-only
Natural-language queryAir-gapped open-source AIRead-only securityTable/chart answers60+ menu search
Copilot query

① Ask in natural language

"What was yesterday's production output?" — you can also start with suggested-question chips.

Copilot answer

② Answers in tables/charts

Presents query results visualized with summaries and calculations.
Screens

Key Screens

Production → Quality/Yield → SPC → FDC. The four domains are connected by a single data pipeline.

Production
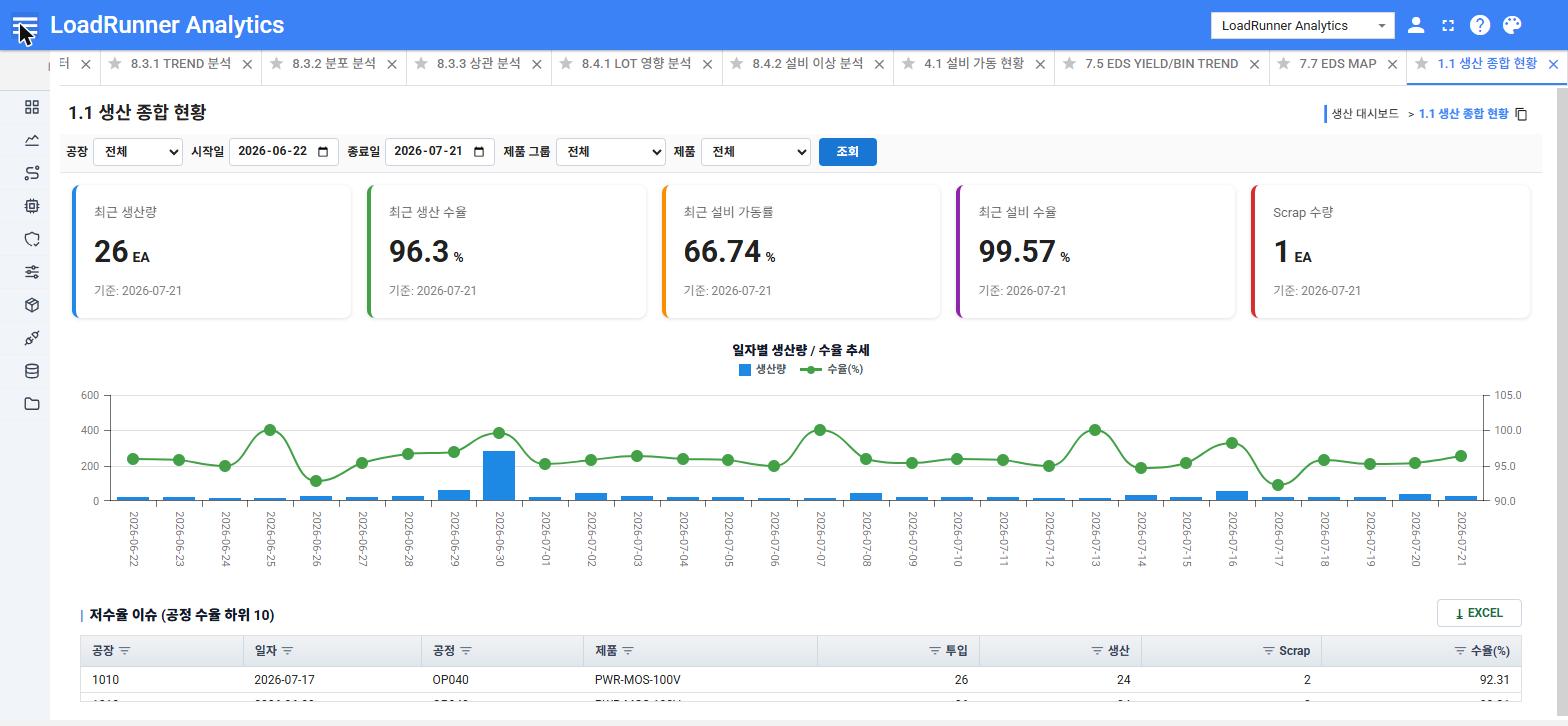
Production overview

Production Overview

KPIs for output, yield and equipment utilization, with daily trends and low-yield issues on one screen.

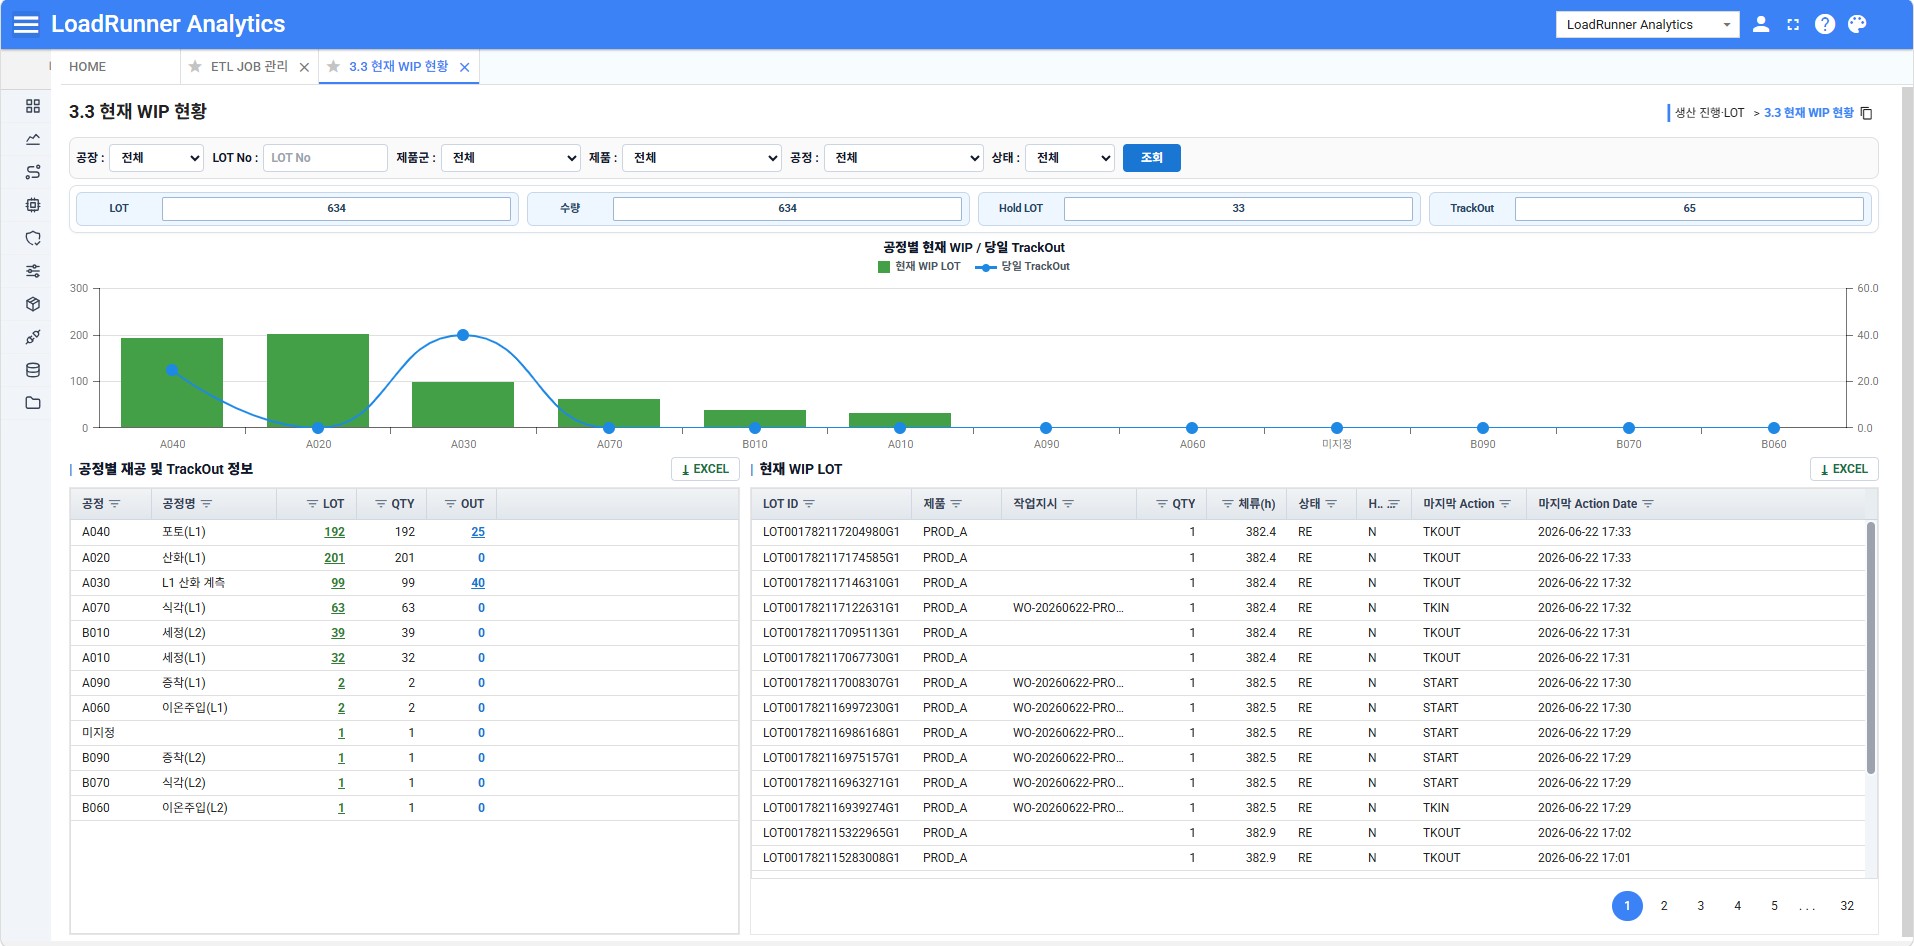
Current WIP status

Current WIP Status

Grasp the WIP distribution by process and status as a snapshot.

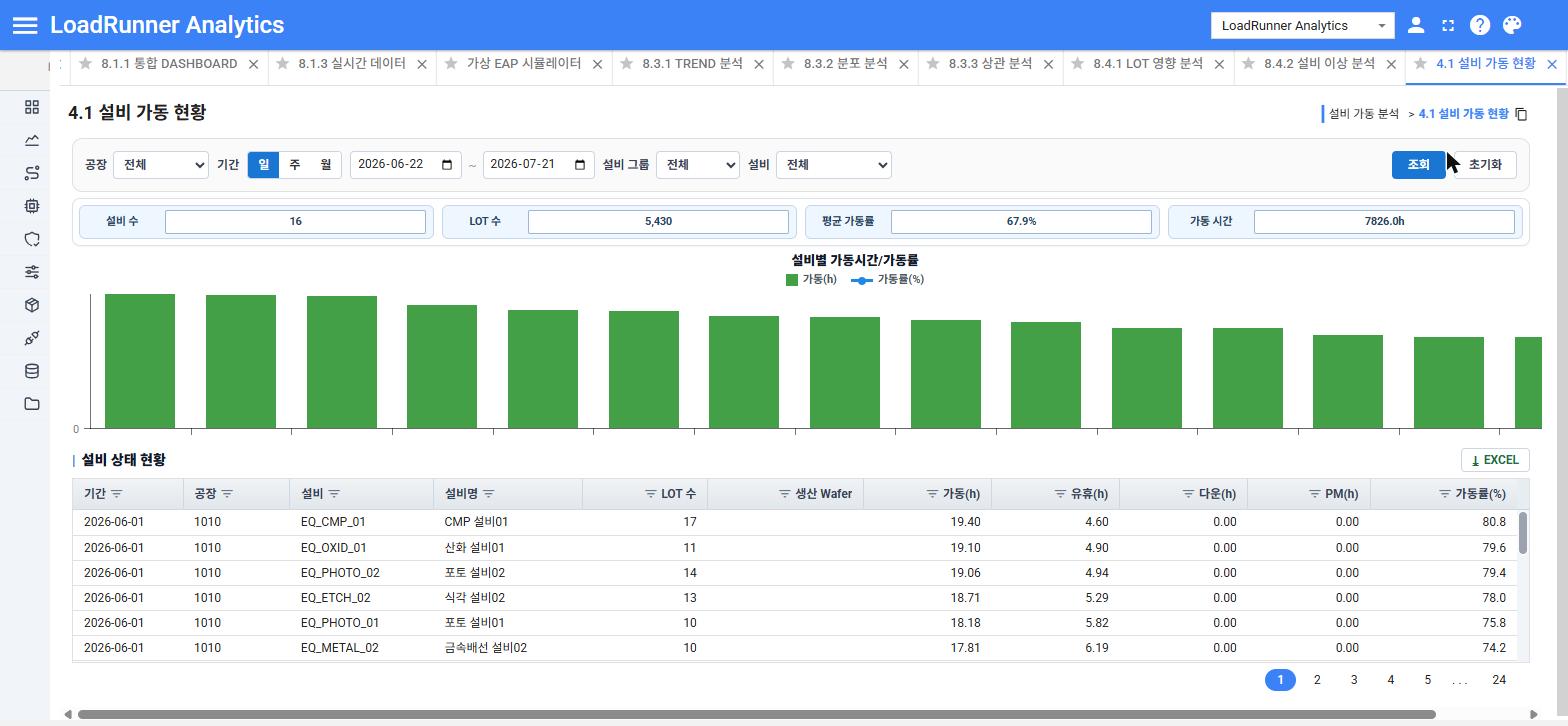
Equipment operation status

Equipment Operation Status

Manage utilization by run/idle/down and OEE per equipment.

Quality · Yield (YMS)
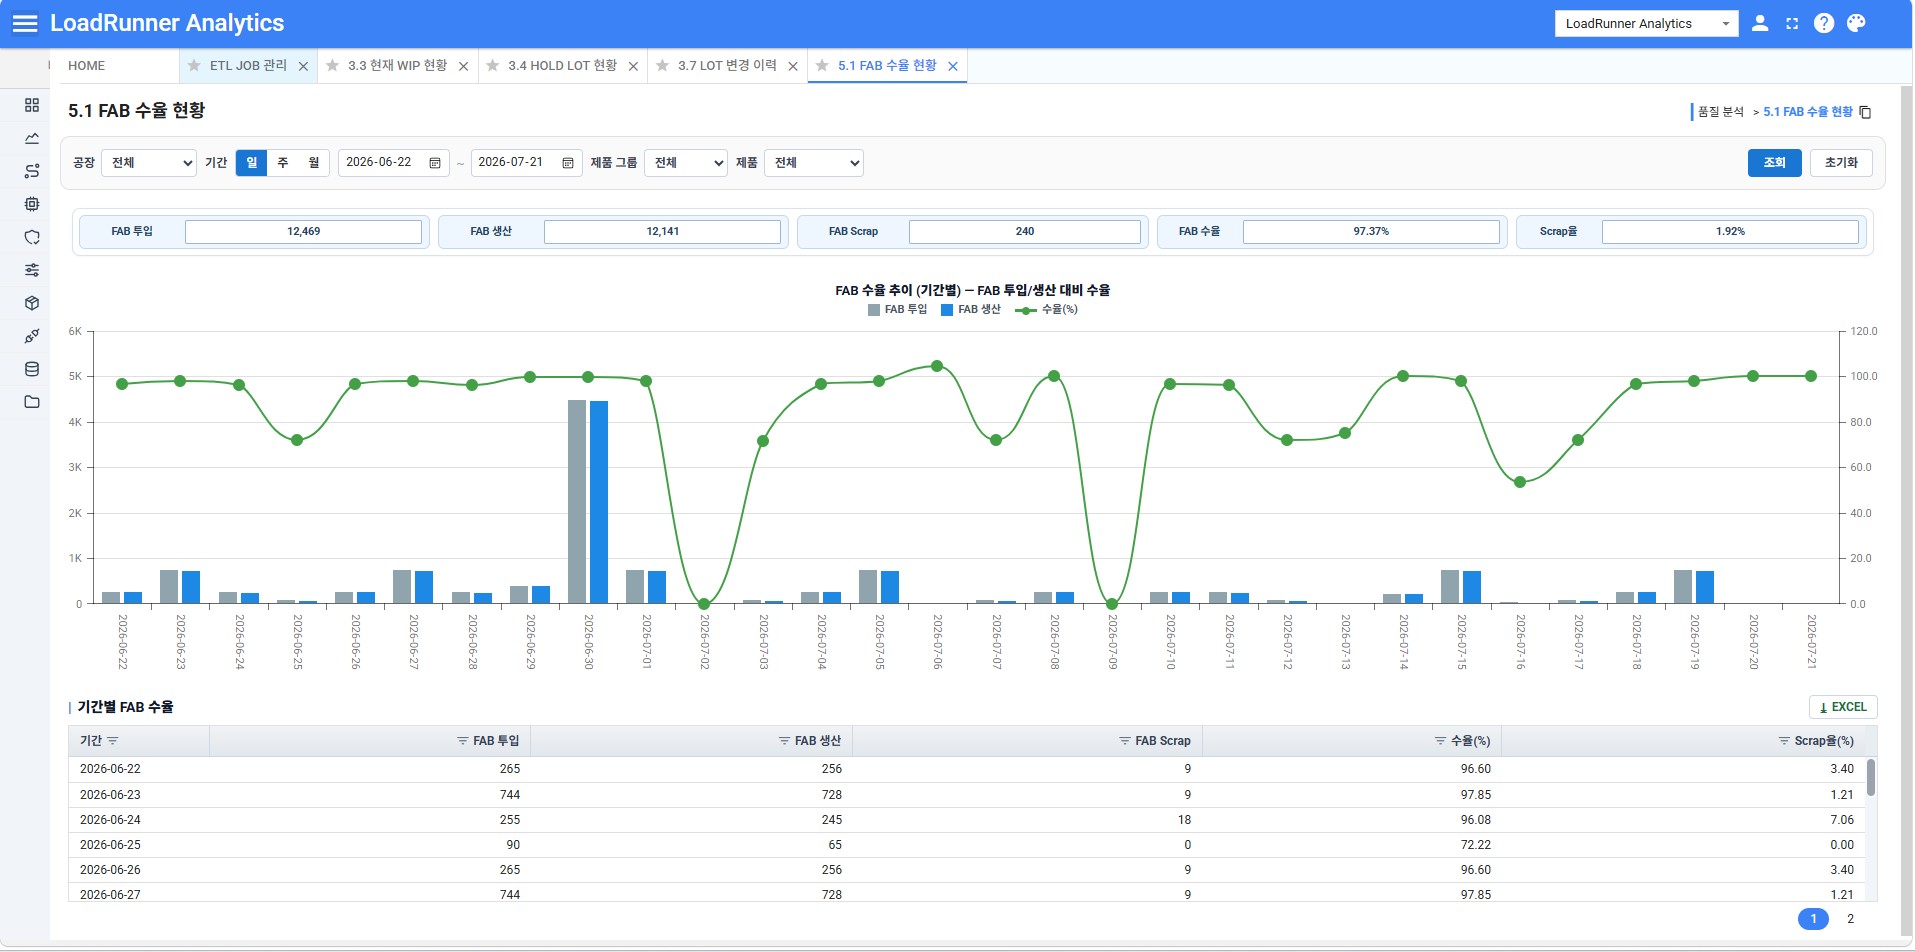
FAB yield status

FAB Yield Status

Output-vs-input yield at the line and FAB level.

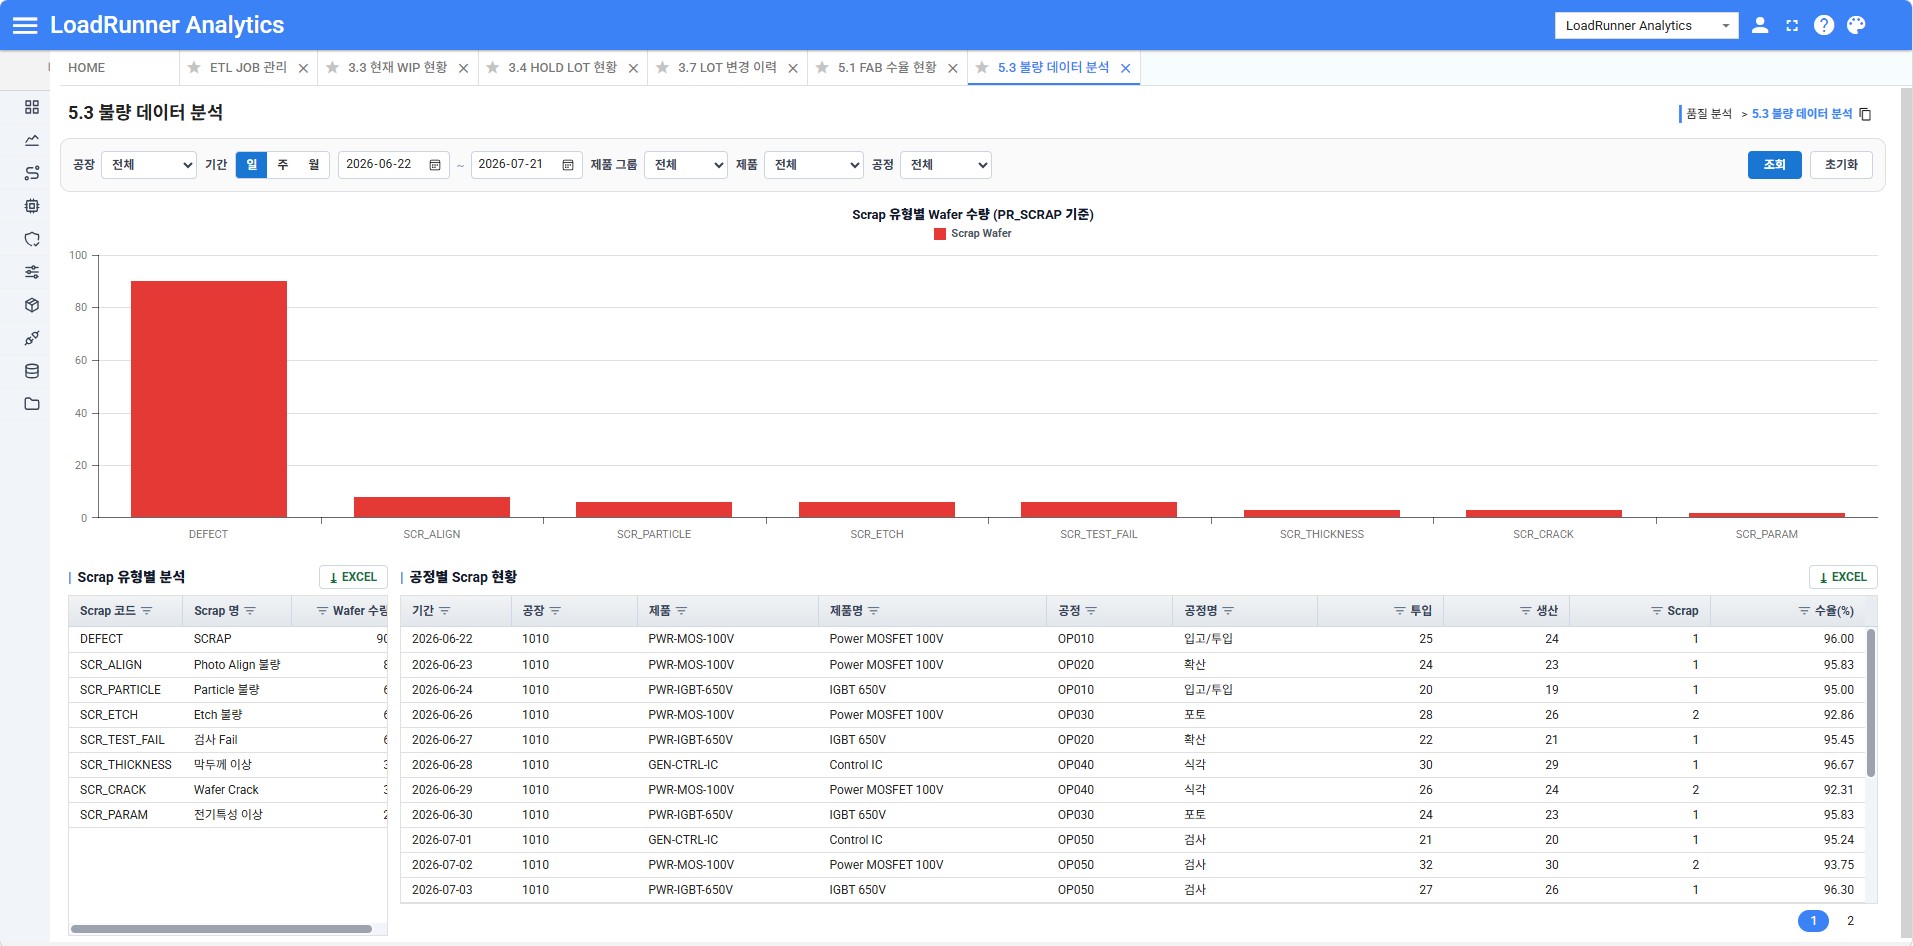
Defect data analysis

Defect Data Analysis

Identify major causes via Pareto by defect type and process.

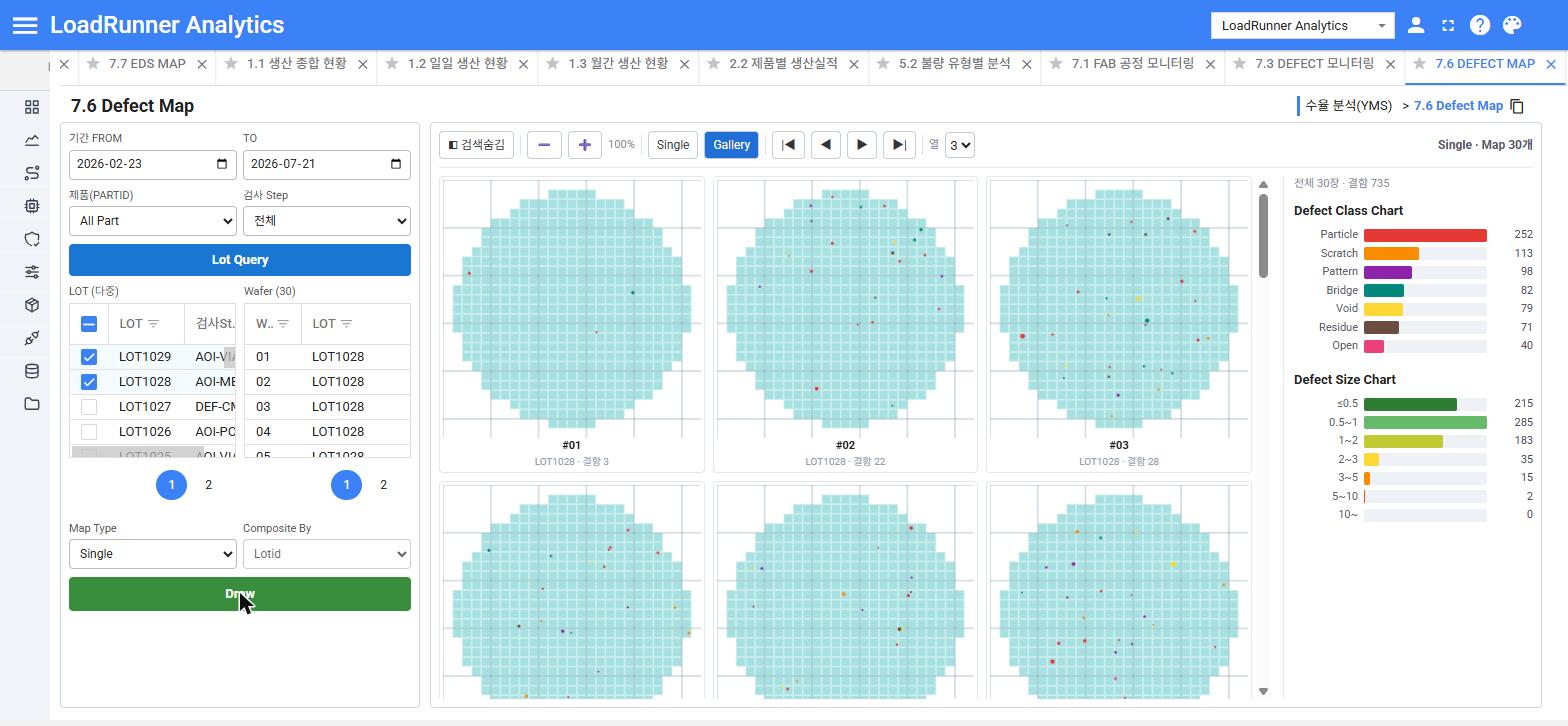
Defect Map

Defect Map

Visualize and compare wafer defects on a coordinate map.

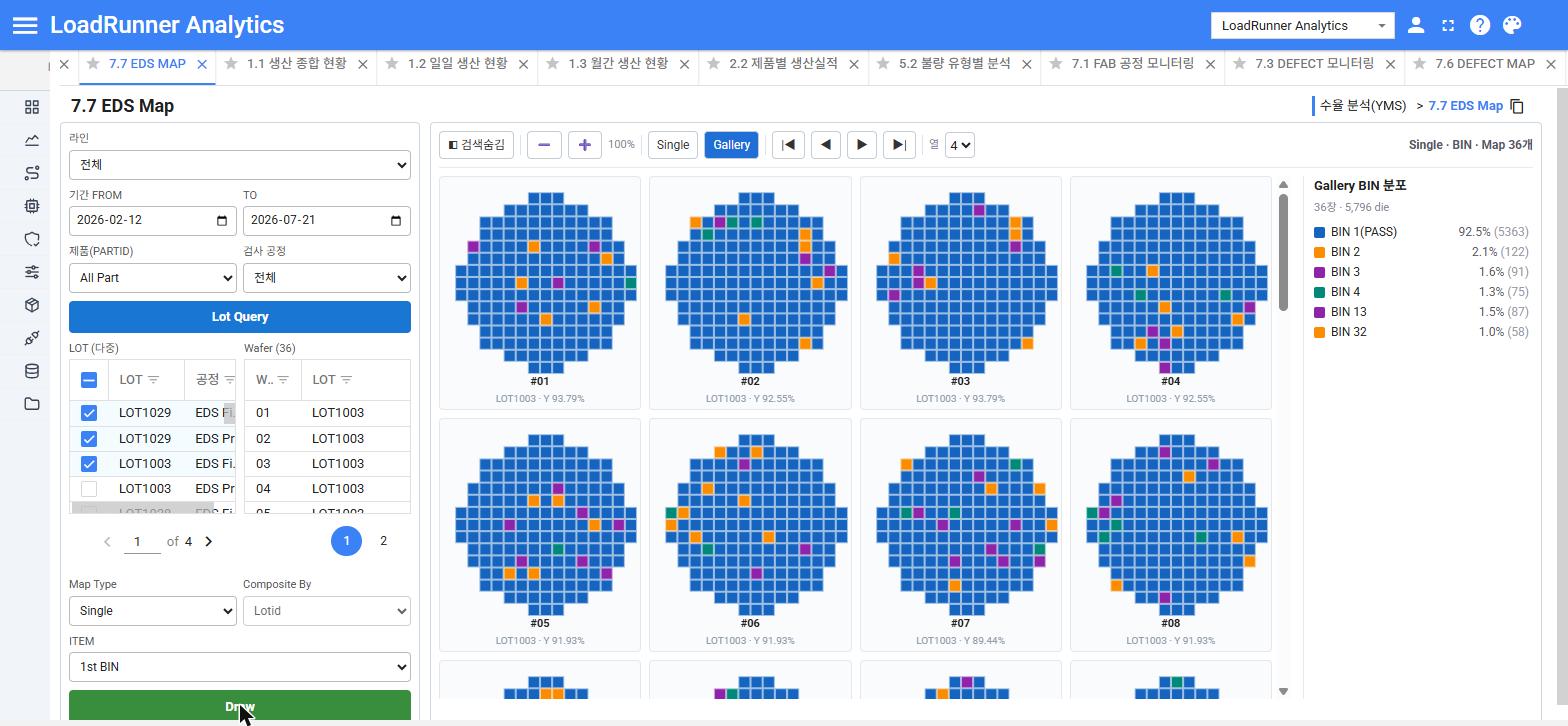
EDS Map

EDS Map

Compare defect distribution per LOT with a Bin (pass/fail) map.

SPC (Statistical Process Control)
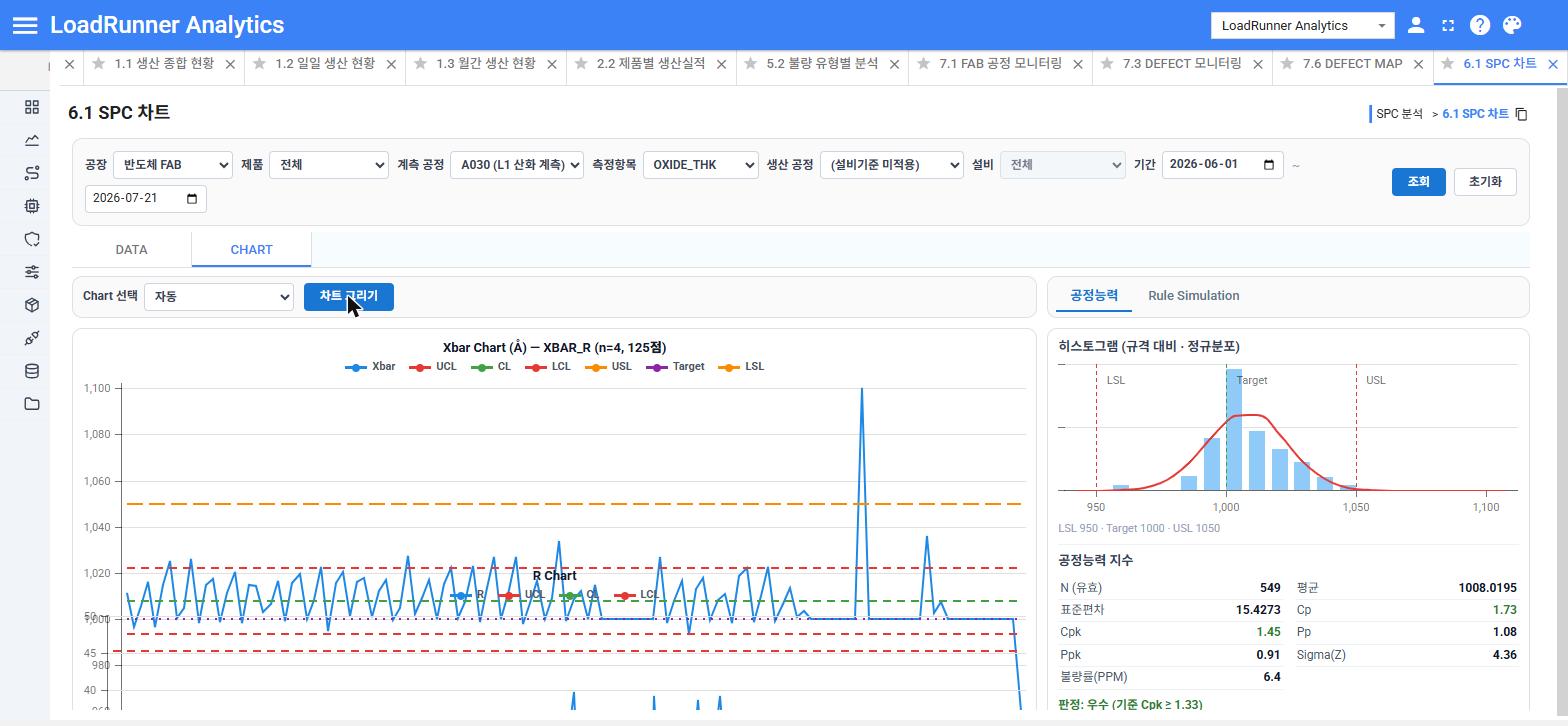
SPC control chart

SPC Control Chart

Manage center and dispersion with Xbar-R charts, detecting rule violations.

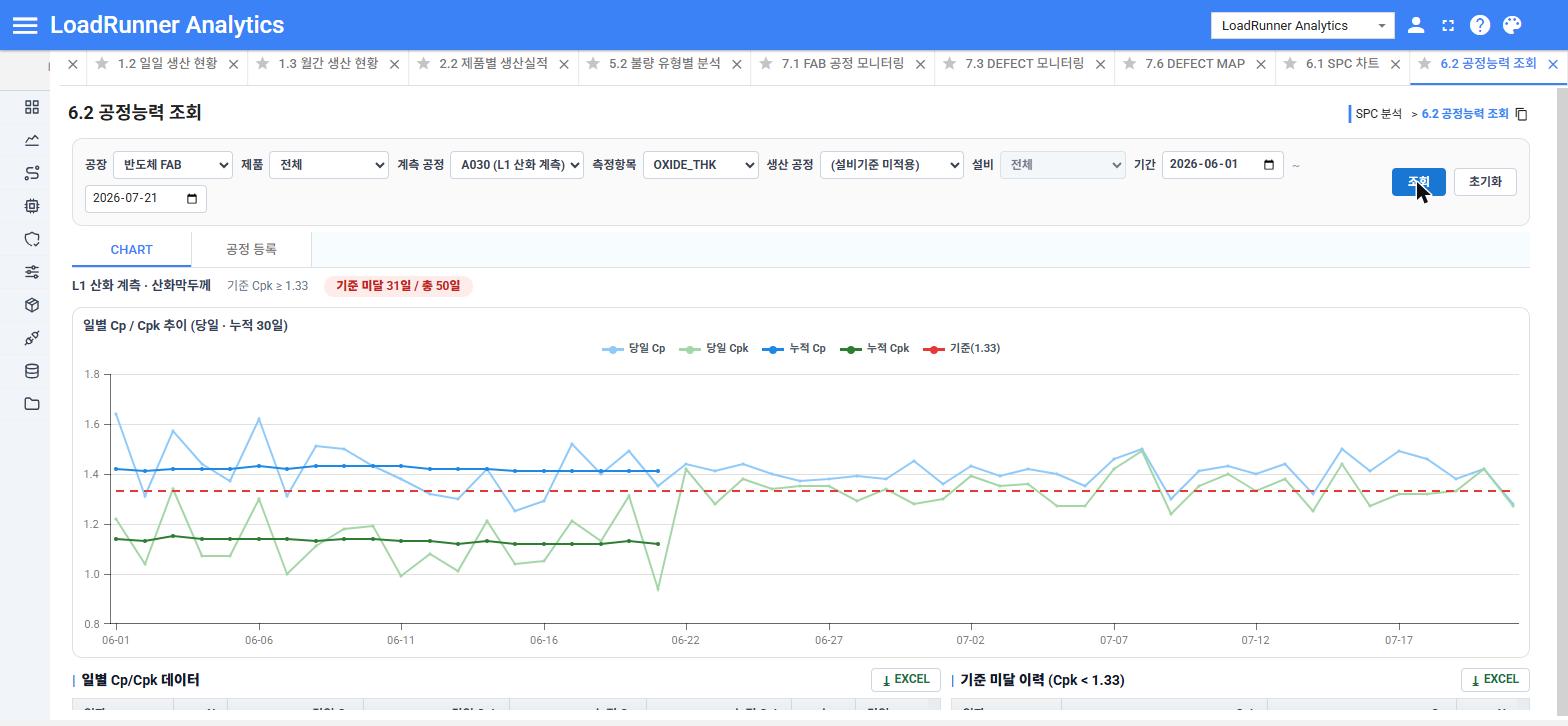
Process capability

Process Capability

Check conformance to specifications by monitoring daily Cp/Cpk.

FDC (Fault Detection & Classification)
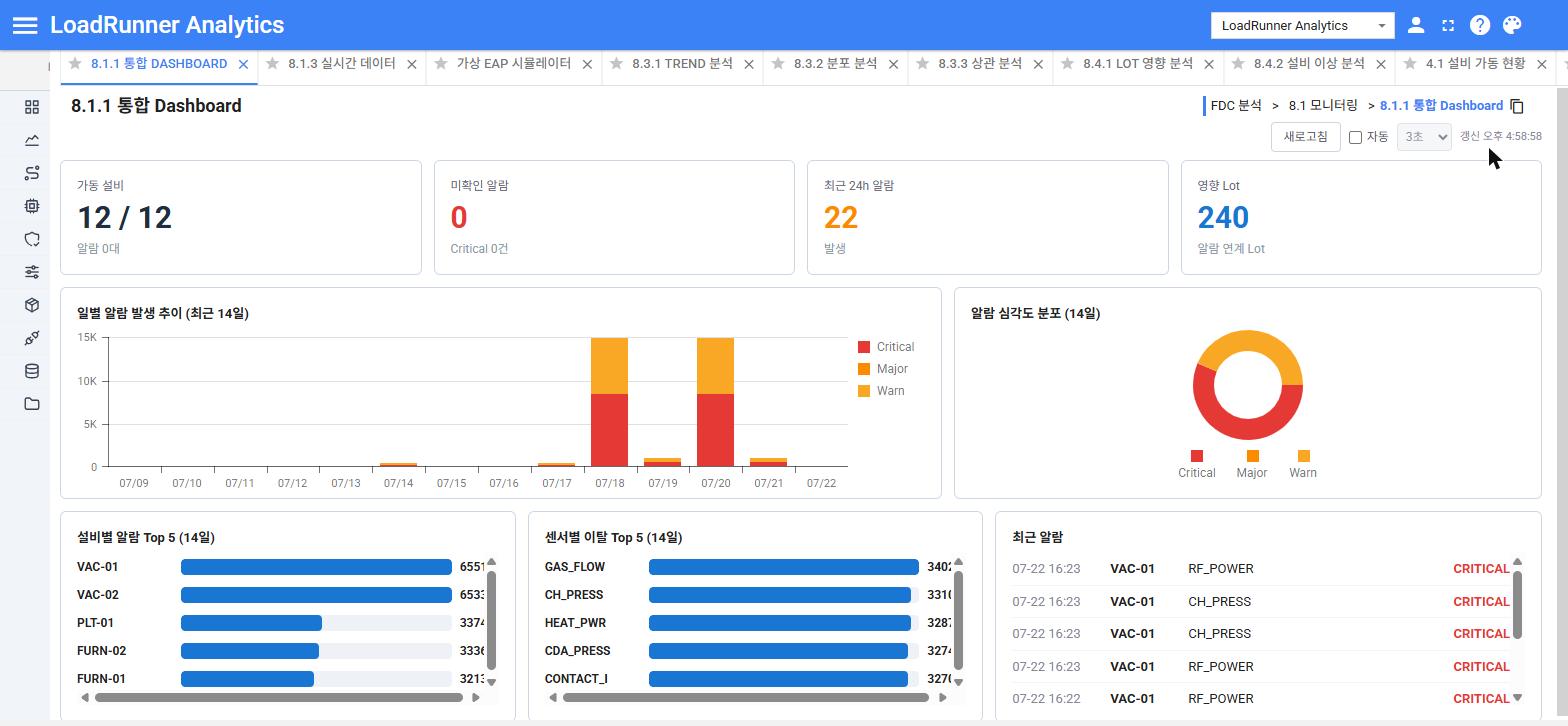
FDC integrated dashboard

FDC Integrated Dashboard

Overall status plus alarm aggregation by severity, equipment and sensor.

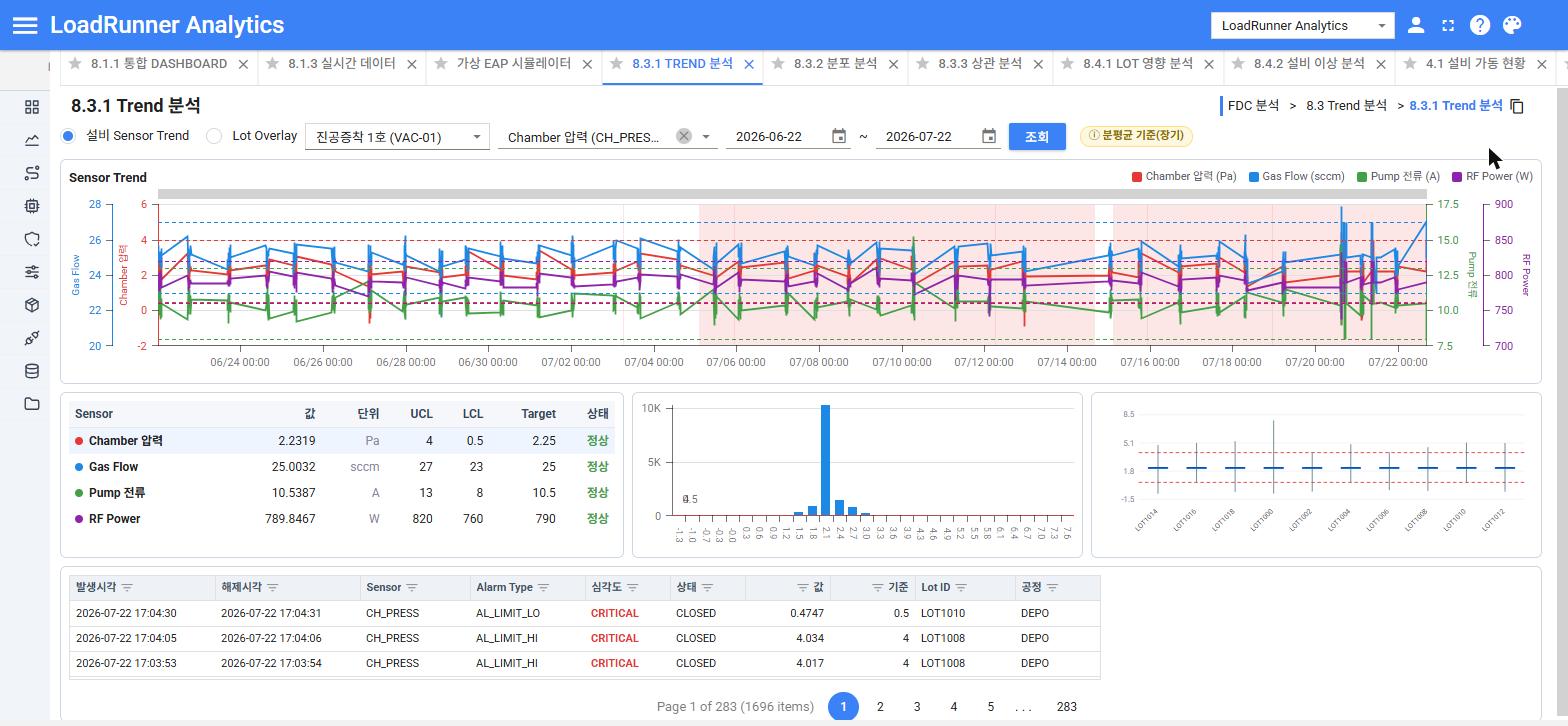
Sensor Trend analysis

Sensor Trend Analysis

Monitor trends of multiple sensors together with control limits.

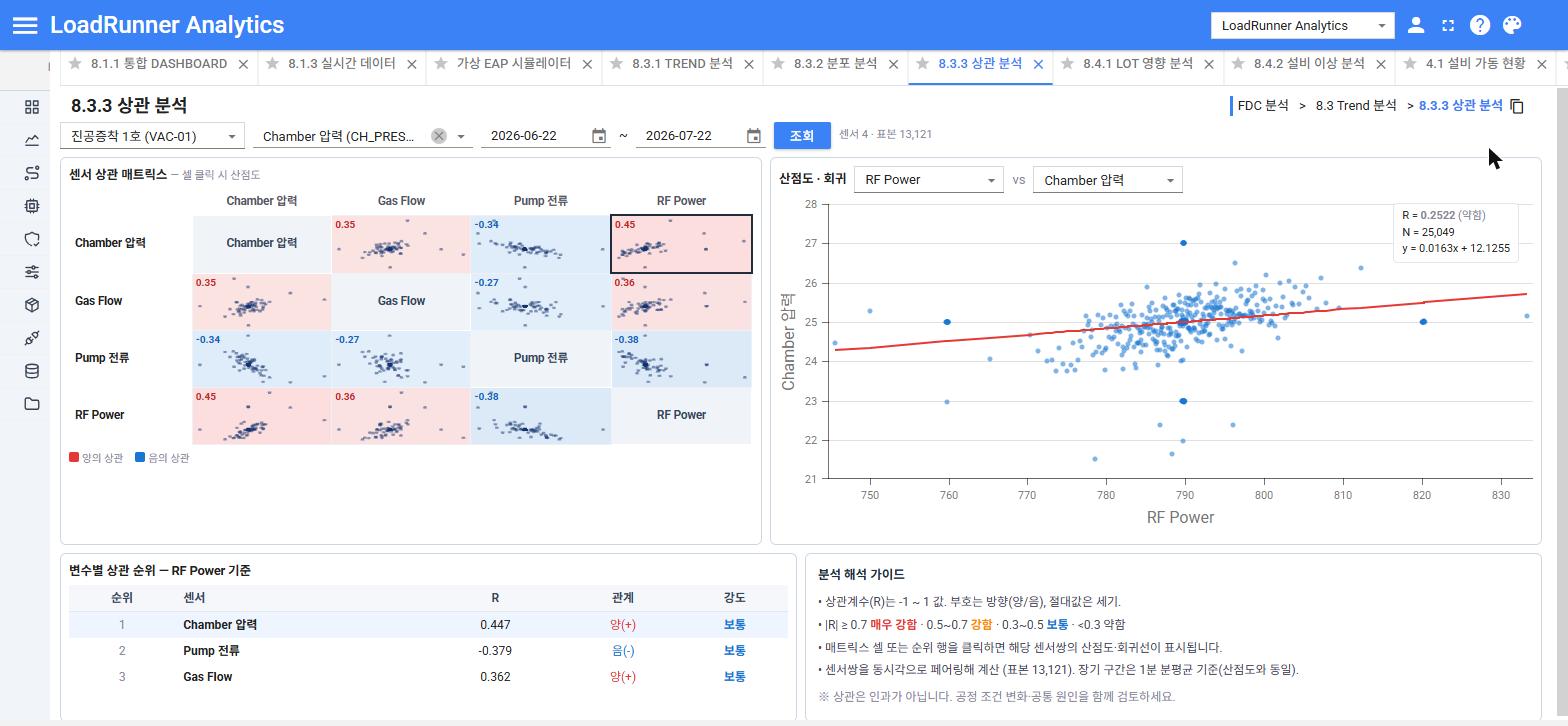
Sensor correlation analysis

Sensor Correlation Analysis

Click a correlation-matrix cell → scatter plot and regression line (~8× faster with DB pivot).

Create Automation World

Ask with Data, Answer with Data

We provide OneIQ consultations and demos.

Contact UsAbout Us